Opening Reports
From the left sidebar, click Reports to expand the reports menu. You will see sub-categories for each report type.
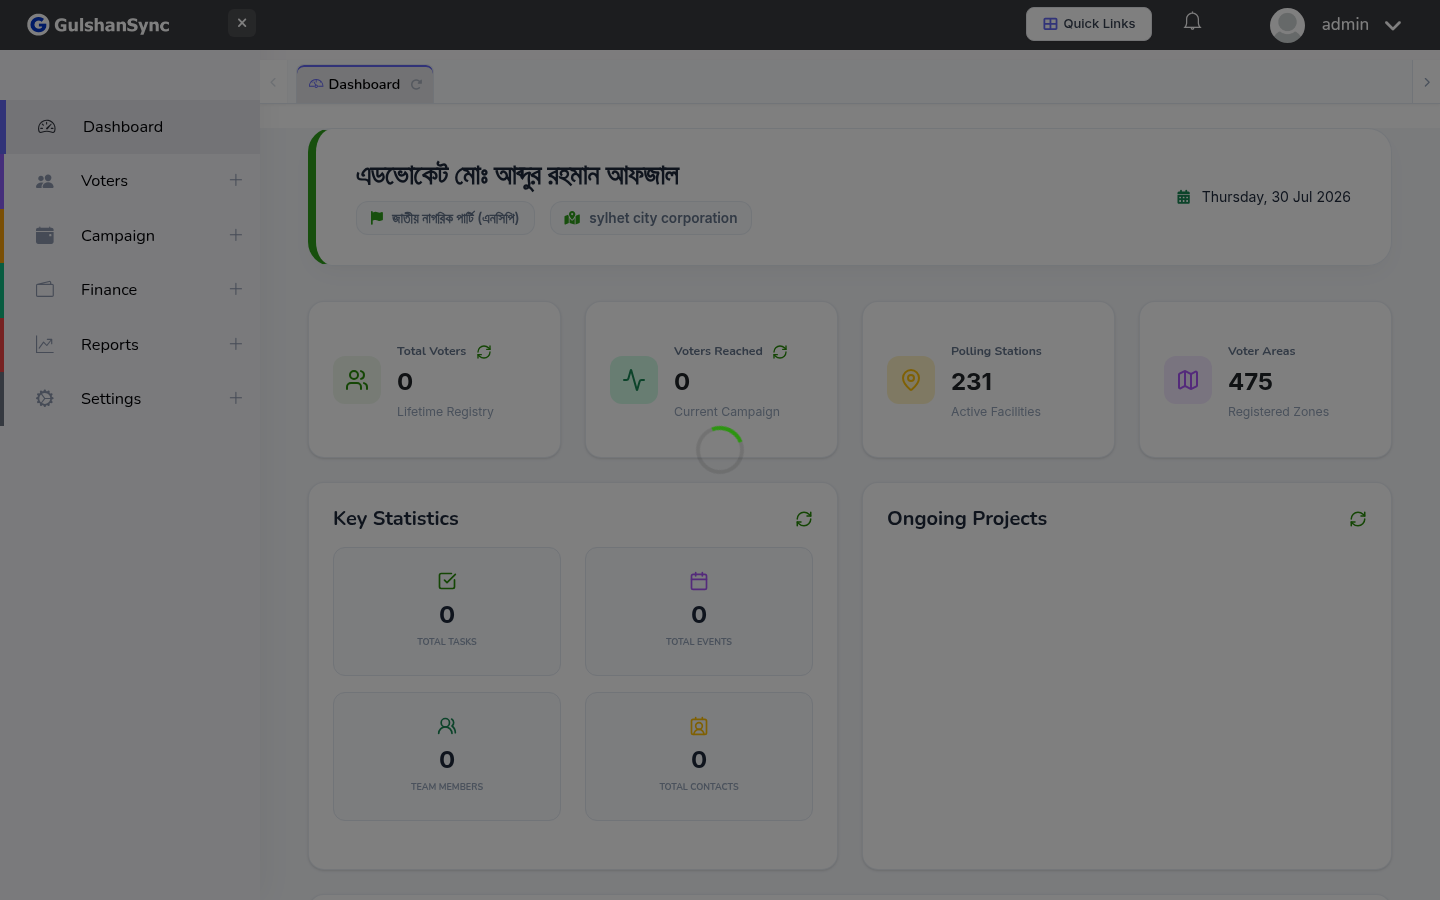
Report Categories
| Category | Number of Reports | What they cover |
|---|---|---|
| Voter Reports | 15+ | Demographics, status, preferences, age, occupation, turnout forecast |
| Finance Reports | 10+ | Account statement, income, expense, transfer, income vs expense, by payer/payee |
| Project Reports | 6 | Project summary, details, task completion, milestone achievement, project expense |
| Key Issue Reports | 7 | Overview, detail list, category, geographic, trend, staff activity, intelligence |
| Constituency Reports | 10+ | Total voters by union, ranking, millennials, Gen Z, profession, student, unemployment |
| Operational Reports | 5+ | Event report, polling station, team location, opposition strength, undecided tracker |
Using Reports
Every report has:
- Filters at the top — date range, geographic area, project, etc.
- Charts — pie, bar, line, gauge, depending on the report
- Data tables — sortable, with totals
- Export buttons — Excel and PDF
- Print button — produces a print-ready view
Most-Used Reports
For a campaign manager, the most valuable reports are:
- Voter Demographics — who are your voters?
- Canvassing Coverage — which areas have been canvassed?
- Turnout Forecast — predicted turnout for election day
- Opposition Strength — where the opposition is strong
- Undecided Tracker — undecided voters who could be swayed
- Project Summary — overall campaign project status
- Income vs Expense — financial health at a glance